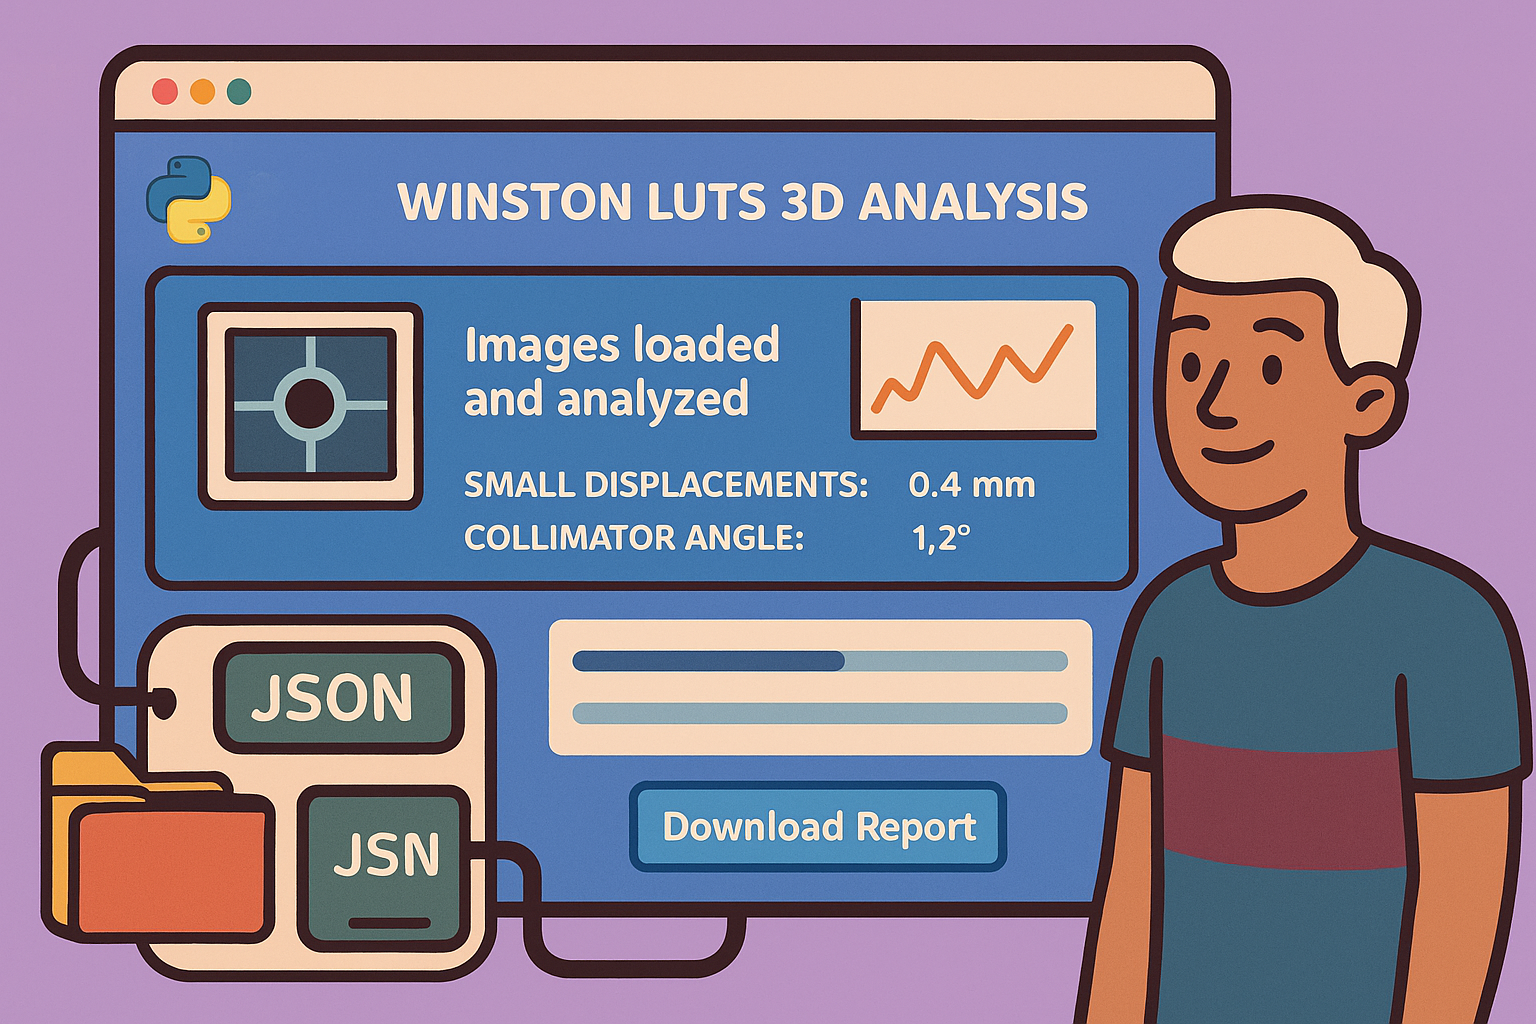
In the realm of medical physics, precision is paramount, especially when it comes to radiotherapy. Evaluating the accuracy of a linear accelerator’s (linac) isocenter is a critical quality assurance (QA) task. One of the most common and robust methods for this is the Winston-Lutz test. This blog post will guide you through performing a 3D Winston-Lutz analysis using a Streamlit web application powered by the Pylinac Python library, demonstrating how accessible and powerful such tools can be for medical physicists.
This demonstration stems from a client’s request to compare our analytical tools against their existing software, a testament to the value of robust, verifiable solutions in medical QA.
Accessing the 3D Winston-Lutz Tool
To begin, navigate to our showcase website. Here, you’ll find a wealth of information, including blog articles, tech news, and details about our services. Look for the “Streamlit Demo” button, typically located in the top right corner. Clicking this will redirect you to our dedicated Streamlit web application platform, hosting various interactive demos.
Access the Application: Go to kaptan-data-solutions.app/winston-lutz_3d
These demos, while presented manually for demonstration purposes, highlight the potential for full automation. Imagine a workflow where your DICOM images are automatically retrieved from a designated folder, analyzed, and a detailed report is generated and emailed or stored securely. This level of automation is achievable with Python and orchestration tools.
Among the various tools available, locate the “Winston-Lutz 3D” option. While a 2D version and other utilities are also present, our focus today is on the comprehensive 3D analysis. These tools showcase our capability to develop solutions across diverse subjects, leveraging both established libraries and custom algorithms for tasks like Statistical Process Control (SPC) or even AI-driven chatbots.
Step-by-Step 3D Winston-Lutz Analysis
Let’s dive into the practical steps of performing a 3D Winston-Lutz analysis.
Step 1: Uploading DICOM Images
The application requires your Winston-Lutz DICOM images to be uploaded as a single ZIP archive. This ensures all relevant images are bundled together for proper processing. Once uploaded, the application automatically decompresses the archive and displays key DICOM information.
For the particular dataset used in this demonstration, the images indicate a table position consistently at 0 degrees. The acquisition involved gantry rotations at 0, 90, and 180 degrees, while the collimator was rotated at 90 and 270 degrees. This combination of angles is crucial for a comprehensive 3D analysis.
Step 2: Initiating the Analysis
After uploading the zipped images, simply click the “Analyze Results” button to start the analysis. The application will begin processing, displaying a progress indicator.
By default, the analysis uses standard parameters, such as a 5mm central ball size. However, the interface allows for custom adjustments if needed, though for this demonstration, we’ll proceed with the default settings. For those interested in the intricate details of the Pylinac library and its 3D Winston-Lutz implementation, consulting the official Pylinac documentation is highly recommended.
Step 3: Interpreting the Results
Upon completion of the analysis, the application presents a suite of metrics and visualizations.
One of the most crucial outputs is the reported translation or offset. The example analysis showed very small offsets: approximately 0.01 mm to the right, 0.01 mm towards the head, and 0.01 mm upwards. Such minuscule values indicate excellent isocenter accuracy.
The tool also includes visual analyses, which typically display displacements of the EPID (Electronic Portal Imaging Device), gantry, and couch. In this specific demonstration, some of these graphical visualizations might not populate, potentially due to the nature of the image acquisition (e.g., lack of specific gantry or couch movements recorded in the images). However, the collimator displacement graph was visible.
A particularly insightful visualization is the graphical representation showcasing the ball (blue, 5mm diameter) relative to the isocenter (green cross). When the offsets are as minimal as observed, these shifts are almost imperceptible on the graph, further reinforcing the high accuracy of the linac.
Step 4: Generating a Report
For documentation and record-keeping, the application allows you to download a comprehensive report. Navigate to the final tab, input your name and any relevant comments, and then click to download the pre-formatted report.
The generated report summarizes the analysis, including all the quantitative metrics and, where populated, the visual graphs. Even if some graphs do not appear (as might happen if source image parameters lack certain motion data), the essential numerical results are always included, providing a clear summary of the linac’s performance.
Conclusion
This walk-through demonstrates the power and simplicity of using Streamlit applications with Python libraries like Pylinac for critical medical physics QA tasks. The 3D Winston-Lutz analysis is just one example of how such tools can provide rapid, accurate, and easily interpretable results, aiding physicists in maintaining the highest standards of precision in radiotherapy. We encourage you to explore our demos and leverage these tools, perhaps even comparing them against your current solutions, to experience firsthand the efficiency and reliability they offer.
🔍 Discover Kaptan Data Solutions — your partner for medical-physics data science & QA!
We're a French startup dedicated to building innovative web applications for medical physics, and quality assurance (QA).
Our mission: provide hospitals, cancer centers and dosimetry labs with powerful, intuitive and compliant tools that streamline beam-data acquisition, analysis and reporting.
🌐 Explore all our medical-physics services and tech updates
💻 Test our ready-to-use QA dashboards online
Our expertise covers:
🔬 Patient-specific dosimetry and image QA (EPID, portal dosimetry)
📈 Statistical Process Control (SPC) & anomaly detection for beam data
🤖 Automated QA workflows with n8n + AI agents (predictive maintenance)
📑 DICOM-RT / HL7 compliant reporting and audit trails
Leveraging advanced Python analytics and n8n orchestration, we help physicists automate routine QA, detect drifts early and generate regulatory-ready PDFs in one click.
Ready to boost treatment quality and uptime? Let’s discuss your linac challenges and design a tailor-made solution!
Get in touch to discuss your specific requirements and discover how our tailor-made solutions can help you unlock the value of your data, make informed decisions, and boost operational performance!

Comments