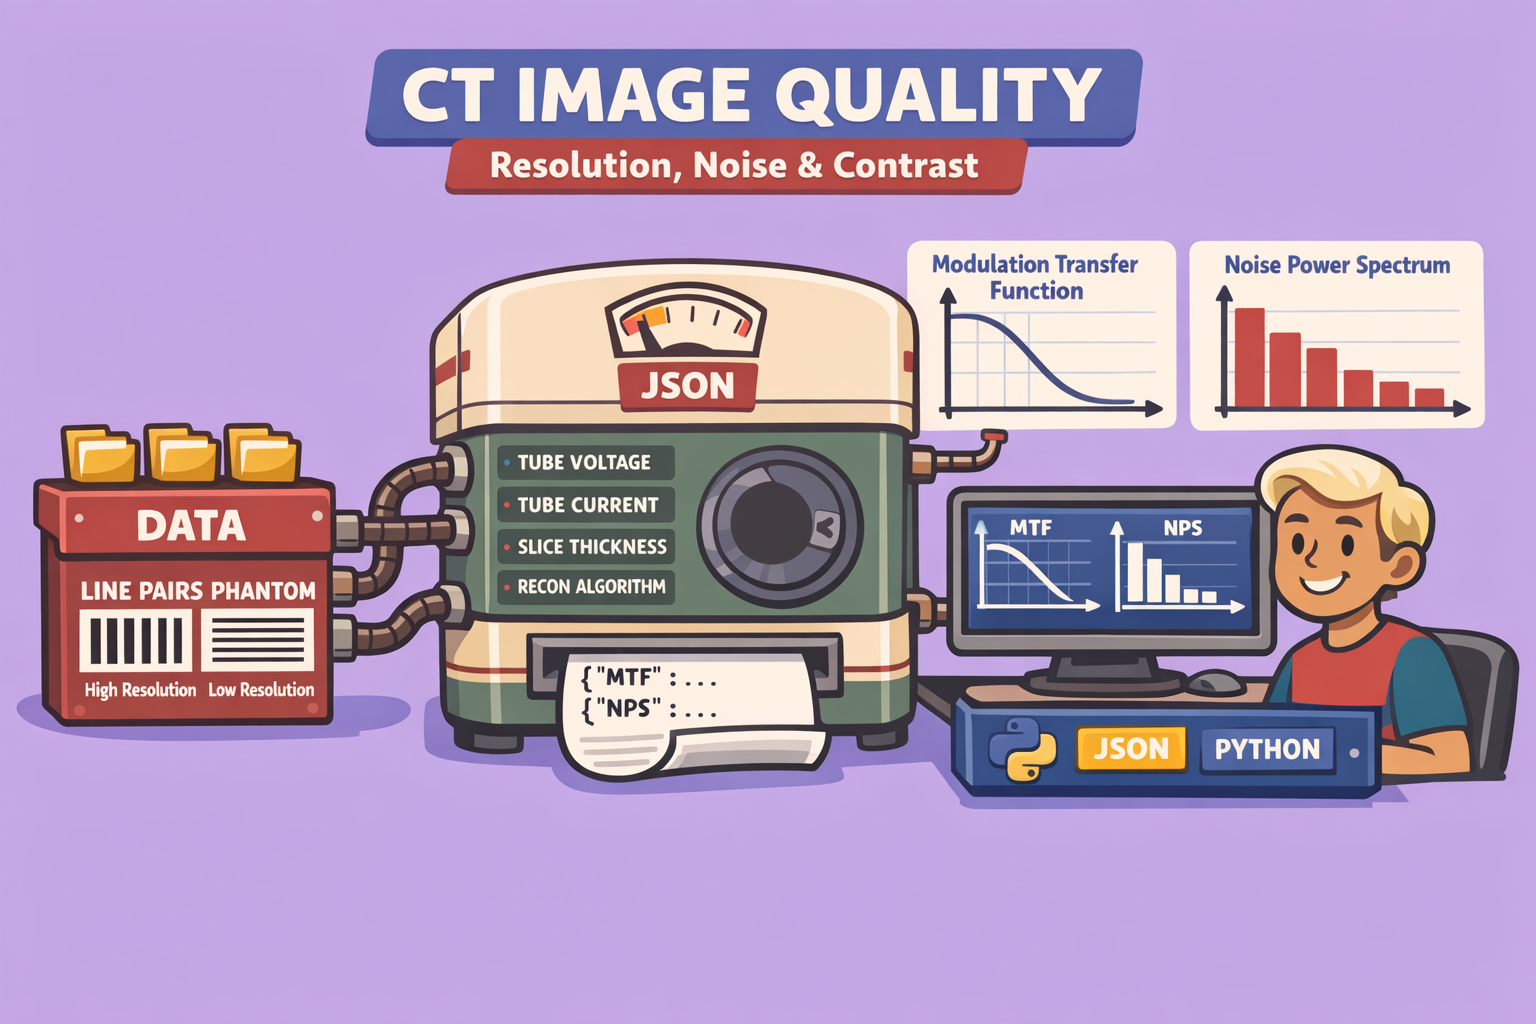
In the realm of medical imaging, particularly Computed Tomography (CT), the quality of an image is paramount for accurate diagnosis and treatment planning. Understanding the factors that influence image quality allows medical professionals to optimize scan parameters and machine components to achieve the best possible diagnostic outcome. This comprehensive guide delves into the three primary categories of CT image quality: spatial resolution, noise, and contrast resolution.
Understanding CT Image Quality
CT image quality can be broadly assessed by four characteristics: spatial resolution, noise, contrast resolution, and artifacts. While artifacts are critical, this discussion focuses on the first three, exploring how they are measured and influenced.
1. Spatial Resolution
Spatial resolution refers to the ability to distinguish two adjacent structures as distinct entities within an image. This can be evaluated in two dimensions:
- Transaxial Resolution (XY-plane): The ability to separate structures in the plane perpendicular to the CT gantry’s axis of rotation.
- Z-axis Resolution (Longitudinal Axis): The ability to separate structures along the patient’s long axis.
How to Measure Spatial Resolution
Spatial resolution can be measured both visually and quantitatively.
Visual Measurement: Visual assessment typically uses a phantom containing “line pairs”—alternating black and white stripes of varying widths. The phantom is scanned, and the resulting image is examined to determine the finest line pairs that can still be distinguished. This is often expressed in line pairs per millimeter (lp/mm) or line pairs per centimeter (lp/cm).
For Z-axis resolution, phantoms with closely spaced attenuating rods along the Z-axis are used. By imaging these rods, the effective slice thickness and subsequent resolution can be visually estimated, as resolution cannot be finer than the slice thickness due to partial volume averaging.
Quantitative Measurement (Modulation Transfer Function - MTF): The Modulation Transfer Function (MTF) provides a mathematical, objective measure of spatial resolution.
- Image Acquisition: A highly attenuating rod is placed in the CT scanner, aligned with an axis (e.g., y-axis).
- Cross-Section Analysis: A cross-section of the reconstructed image of the rod is taken, plotting signal intensity against spatial location. Due to resolution limits, the edges of the rod appear blurred rather than perfectly crisp.
- Fourier Transform: This signal intensity plot is subjected to an inverse Fourier transform, breaking it down into component sine waves of different spatial frequencies.
- Low spatial frequencies represent areas where pixel values change slowly (e.g., uniform regions).
- High spatial frequencies represent areas where pixel values change rapidly (e.g., sharp edges, fine details). High spatial frequencies are crucial for good spatial resolution.
- MTF Curve: The MTF plots the system’s ability to transfer spatial resolution from the actual anatomy into the image across various spatial frequencies. At zero spatial frequency, MTF is normalized to one. As spatial frequencies increase, the system’s ability to reproduce these details accurately decreases.
- Limiting Spatial Resolution: The point where the MTF drops to a predefined threshold (commonly 10% of its maximum) is considered the limiting spatial resolution, providing an objective measure of the system’s capability for a given set of scan parameters and reconstruction methods.
Factors Influencing Spatial Resolution
Spatial resolution is influenced by both CT machine components and scanning parameters.
CT Machine Components:
- Detector Size: Smaller detectors improve spatial resolution by allowing finer sampling of the X-ray beam but reduce the number of X-ray photons per detector, potentially lowering the signal-to-noise ratio.
- Focal Spot Size: A smaller focal spot minimizes geometric blur (penumbra) and geometric unsharpness, resulting in sharper images and better spatial resolution. The position of the object relative to the source and detector also affects this blur.
- Detector Offset (Quarter Detector Offset): Shifting the detector array by a quarter of a detector width allows for more unique projections of the anatomy with each rotation. This effectively fills in gaps in the data, improving spatial resolution.
Scanning Parameters:
- Reconstruction Kernel/Filter:
- Bone kernels: Amplify high spatial frequencies, leading to sharper images and better spatial resolution (e.g., for detecting subtle fractures) but often with increased noise.
- Soft tissue kernels: Suppress high spatial frequencies, resulting in less spatial resolution but better subtle contrast resolution (e.g., for differentiating gray and white matter).
- Pixel Size: Smaller pixels, achieved by increasing the matrix size for a given field of view (FOV), improve spatial resolution by allowing for finer detail representation.
- Number of Projections/Pitch:
- More projections: A greater number of X-ray measurements around the anatomy provides more data, leading to better spatial resolution.
- Lower Pitch: A pitch value less than one means regions of anatomy are scanned more than once, effectively increasing the number of projections and improving both XY-plane and Z-axis spatial resolution.
- Slice Thickness: Thinner slices reduce partial volume averaging, improving Z-axis spatial resolution. More detectors or rows of detectors can be binned to create thicker slices, which increases signal but reduces Z-axis resolution.
2. Noise
Noise in a CT image appears as a grainy or mottled texture and obscures fine details. Understanding its sources is crucial for mitigation.
Sources of Noise:
- Quantum/Statistical Noise: The predominant source, caused by the random variation in the number of X-rays reaching each detector. This follows a Poisson distribution. Fewer X-rays lead to more quantum noise.
- Electronic Noise: Inherent noise generated by the detectors and associated electronics during signal acquisition and processing. Amplification of the signal can also introduce noise.
- Reconstruction Noise: Introduced during image reconstruction, particularly with methods like filtered back projection, where noise can be spread throughout the image.
How to Measure Noise
Visual Measurement: Noise can be visually assessed using phantoms containing low-contrast objects (e.g., circles with only 6 Hounsfield units difference from the background). The ability to distinguish these objects, especially as they get smaller, is diminished by noise.
Quantitative Measurement (Noise Power Spectrum - NPS): For a quantitative measure, the standard deviation of Hounsfield unit values within a uniform region of interest in a phantom is calculated. This information is then used to generate a Noise Power Spectrum (NPS). The NPS describes how noise is distributed across different spatial frequencies and characterizes the “texture” of the noise, acknowledging that noise in an image is not independent across pixels.
Improving Signal-to-Noise Ratio (SNR)
Improving SNR involves either increasing the signal or optimizing image processing.
Increasing Signal:
- mAs (Milliampere-seconds): Increasing the tube current and exposure time increases the number of X-rays produced, leading to more signal reaching the detectors.
- kVp (Kilovoltage Peak): Increasing kVp increases both the number and average energy of X-rays, making the beam more penetrating and increasing signal at the detectors.
- Pitch: A lower pitch (more data sampling) increases the amount of signal collected.
- Slice Thickness: Thicker slices incorporate more detector rows, leading to more signal per slice (though at the expense of Z-axis resolution).
- Tube Current Modulation: Adjusts tube current based on patient anatomy to maintain consistent signal levels in different regions.
- Detector Efficiency: More efficient detectors capture more X-rays, increasing signal.
- Patient Size: While not a controllable factor, larger patients scatter more X-rays and absorb more radiation, requiring higher mAs/kVp to achieve adequate signal and avoid excessive noise.
Image Processing and Reconstruction:
- Iterative Reconstruction: Advanced reconstruction algorithms that model the imaging process and iteratively refine the image, reducing noise more effectively than filtered back projection by accounting for the statistical nature of X-ray photon detection.
- Soft Tissue Filter/Kernel: These filters smooth the image, reducing noise but also decreasing spatial resolution.
- Pixel Size: Larger pixels (achieved by larger FOV or smaller matrix size) pool more signal per voxel, thus reducing noise.
3. Contrast Resolution
Contrast resolution is the ability to differentiate tissues with subtle differences in their X-ray attenuation properties (Hounsfield unit values). It is highly intertwined with noise; generally, factors that reduce noise will improve contrast resolution.
Factors Influencing Contrast Resolution
- Noise Reduction: All methods described above for reducing noise will enhance contrast resolution by making subtle differences more visible.
- kVp (Kilovoltage Peak): This is a unique factor. While increasing kVp reduces noise by increasing beam penetration, it also reduces proportional attenuation differences between tissues.
- Higher kVp: Less contrast between tissues (less attenuation difference), but lower noise.
- Lower kVp: Greater contrast between tissues (more attenuation difference), but higher noise. This is often preferred for visualizing subtle soft tissue differences (e.g., gray-white matter differentiation in the brain).
- Reconstruction Methods: Advanced reconstruction methods that minimize blur can enhance contrast resolution.
- Tissue Composition: Inherent differences in tissue density (e.g., bone vs. soft tissue, clot vs. blood) significantly influence natural contrast.
- Contrast Agents: Intravenous contrast agents (e.g., iodine-based) enhance the attenuation differences of specific tissues or vasculature, dramatically improving contrast resolution in relevant areas.
- Windowing (Width and Level): This post-processing technique adjusts the displayed grayscale range of Hounsfield unit values. It doesn’t change the raw data but optimizes the visual representation of contrast for specific tissues (e.g., bone window, soft tissue window, brain window).
- Reconstruction Kernel/Filter: Specific kernels, particularly soft tissue kernels, can be optimized to highlight low-contrast differences, even if it compromises spatial resolution.
Conclusion
Achieving optimal CT image quality is a balance between spatial resolution, noise, and contrast resolution. These factors are interconnected, and a change in one often affects the others. Medical professionals must carefully select CT machine components and scanning parameters, and utilize appropriate reconstruction and post-processing techniques, to tailor image quality to the specific diagnostic task, ensuring the clearest and most informative images for patient care.
🔍 Discover Kaptan Data Solutions — your partner for medical-physics data science & QA!
We're a French startup dedicated to building innovative web applications for medical physics, and quality assurance (QA).
Our mission: provide hospitals, cancer centers and dosimetry labs with powerful, intuitive and compliant tools that streamline beam-data acquisition, analysis and reporting.
🌐 Explore all our medical-physics services and tech updates
💻 Test our ready-to-use QA dashboards online
Our expertise covers:
🔬 Patient-specific dosimetry and image QA (EPID, portal dosimetry)
📈 Statistical Process Control (SPC) & anomaly detection for beam data
🤖 Automated QA workflows with n8n + AI agents (predictive maintenance)
📑 DICOM-RT / HL7 compliant reporting and audit trails
Leveraging advanced Python analytics and n8n orchestration, we help physicists automate routine QA, detect drifts early and generate regulatory-ready PDFs in one click.
Ready to boost treatment quality and uptime? Let’s discuss your linac challenges and design a tailor-made solution!
Get in touch to discuss your specific requirements and discover how our tailor-made solutions can help you unlock the value of your data, make informed decisions, and boost operational performance!
Comments